DocsAnalytics
Read your analytics
The overview, real time, insights, traffic sources, pages, content, devices, countries, events, site search, missing pages, goals, forms and popups — for any period, compared with another.
Choose a period#
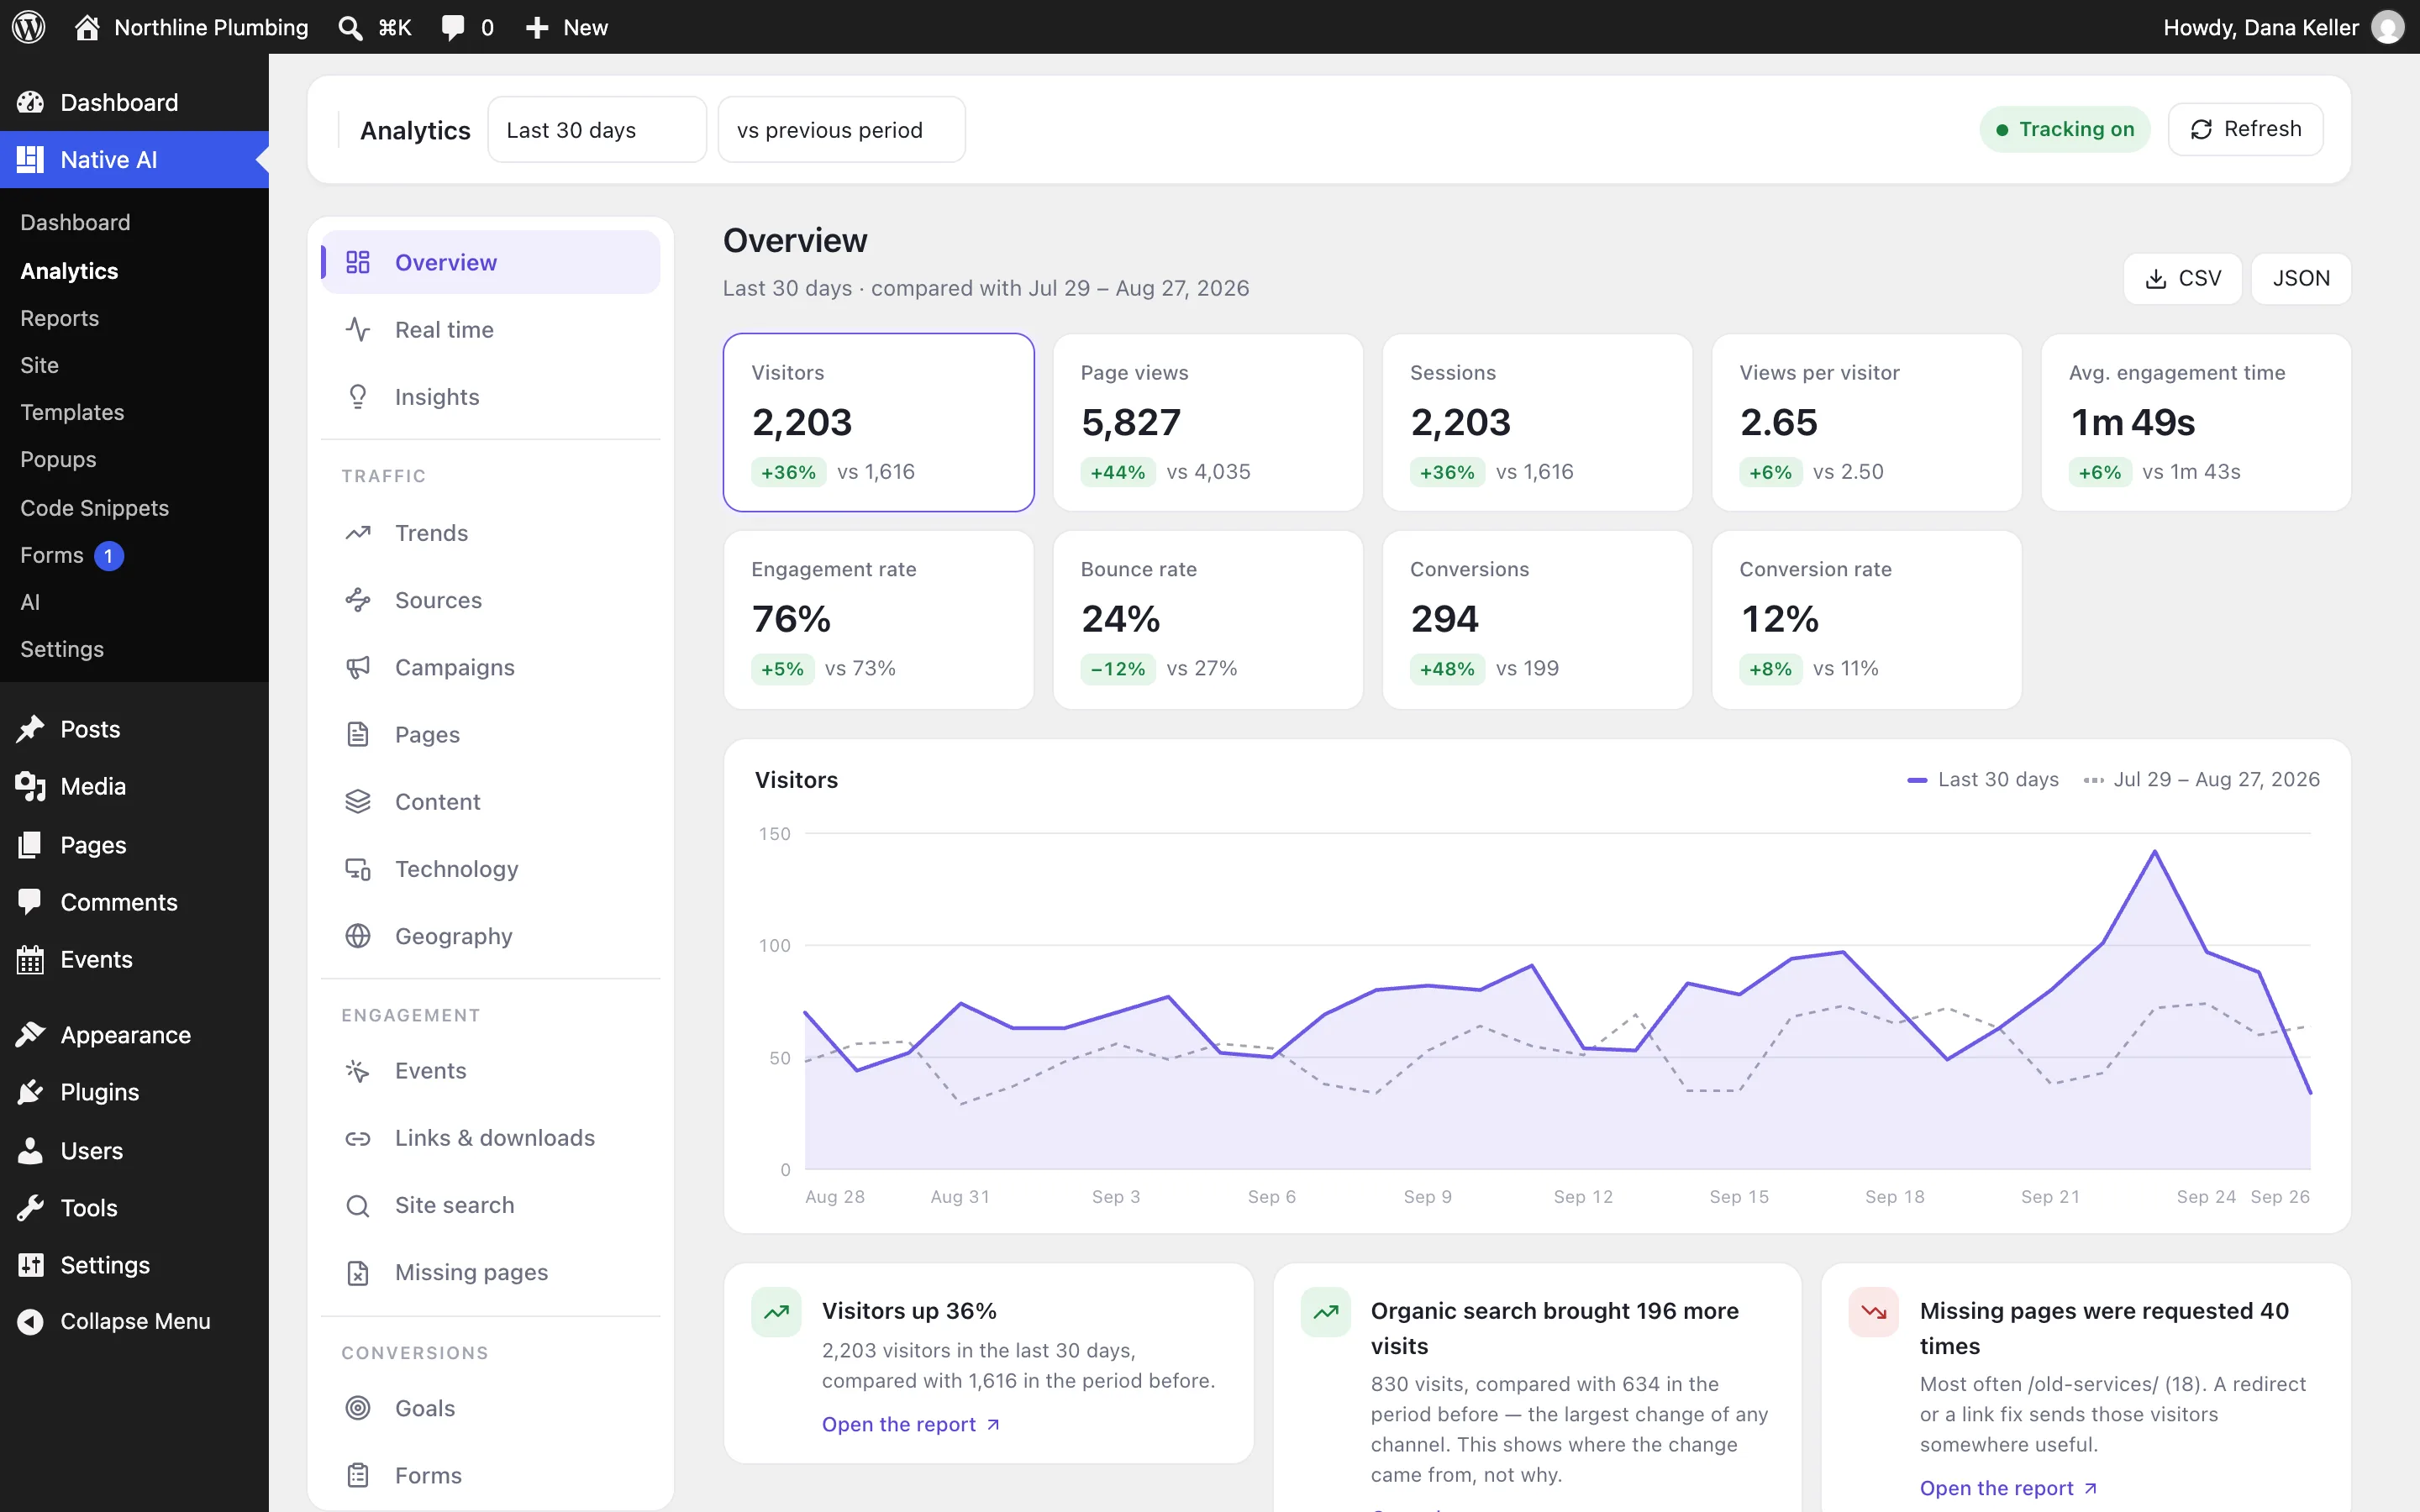
Today, Yesterday, the last 7, 30 or 90 days, This month, Previous month, or custom dates — compared with the previous period, the same days last year, or nothing. Every report uses the same period (your browser remembers it), and days are your site’s days.
The reports#
| Report | What it shows |
|---|---|
| Overview | Visitors, page views, sessions, views per visitor, average engagement time (time the page was actually visible), engagement and bounce rates, conversions and conversion rate — each with its change — plus a chart, insights and the top pages, channels, referrers, devices, countries and goals. |
| Real time | Visitors in the last 5 minutes, page views per minute, pages being viewed, where visitors came from, recent events and conversions. Refreshes every 15 seconds. |
| Insights | Up to 8 plain-language findings, each with its numbers and a link to the report: traffic changes and the channel behind them, conversion-rate changes, goals that stopped, missing pages, mobile vs desktop, landing pages people leave, new referrers, searches with no results. |
| Trends | Visitors, views, visits, engagement and conversions by day, week or month, with the comparison point by point. |
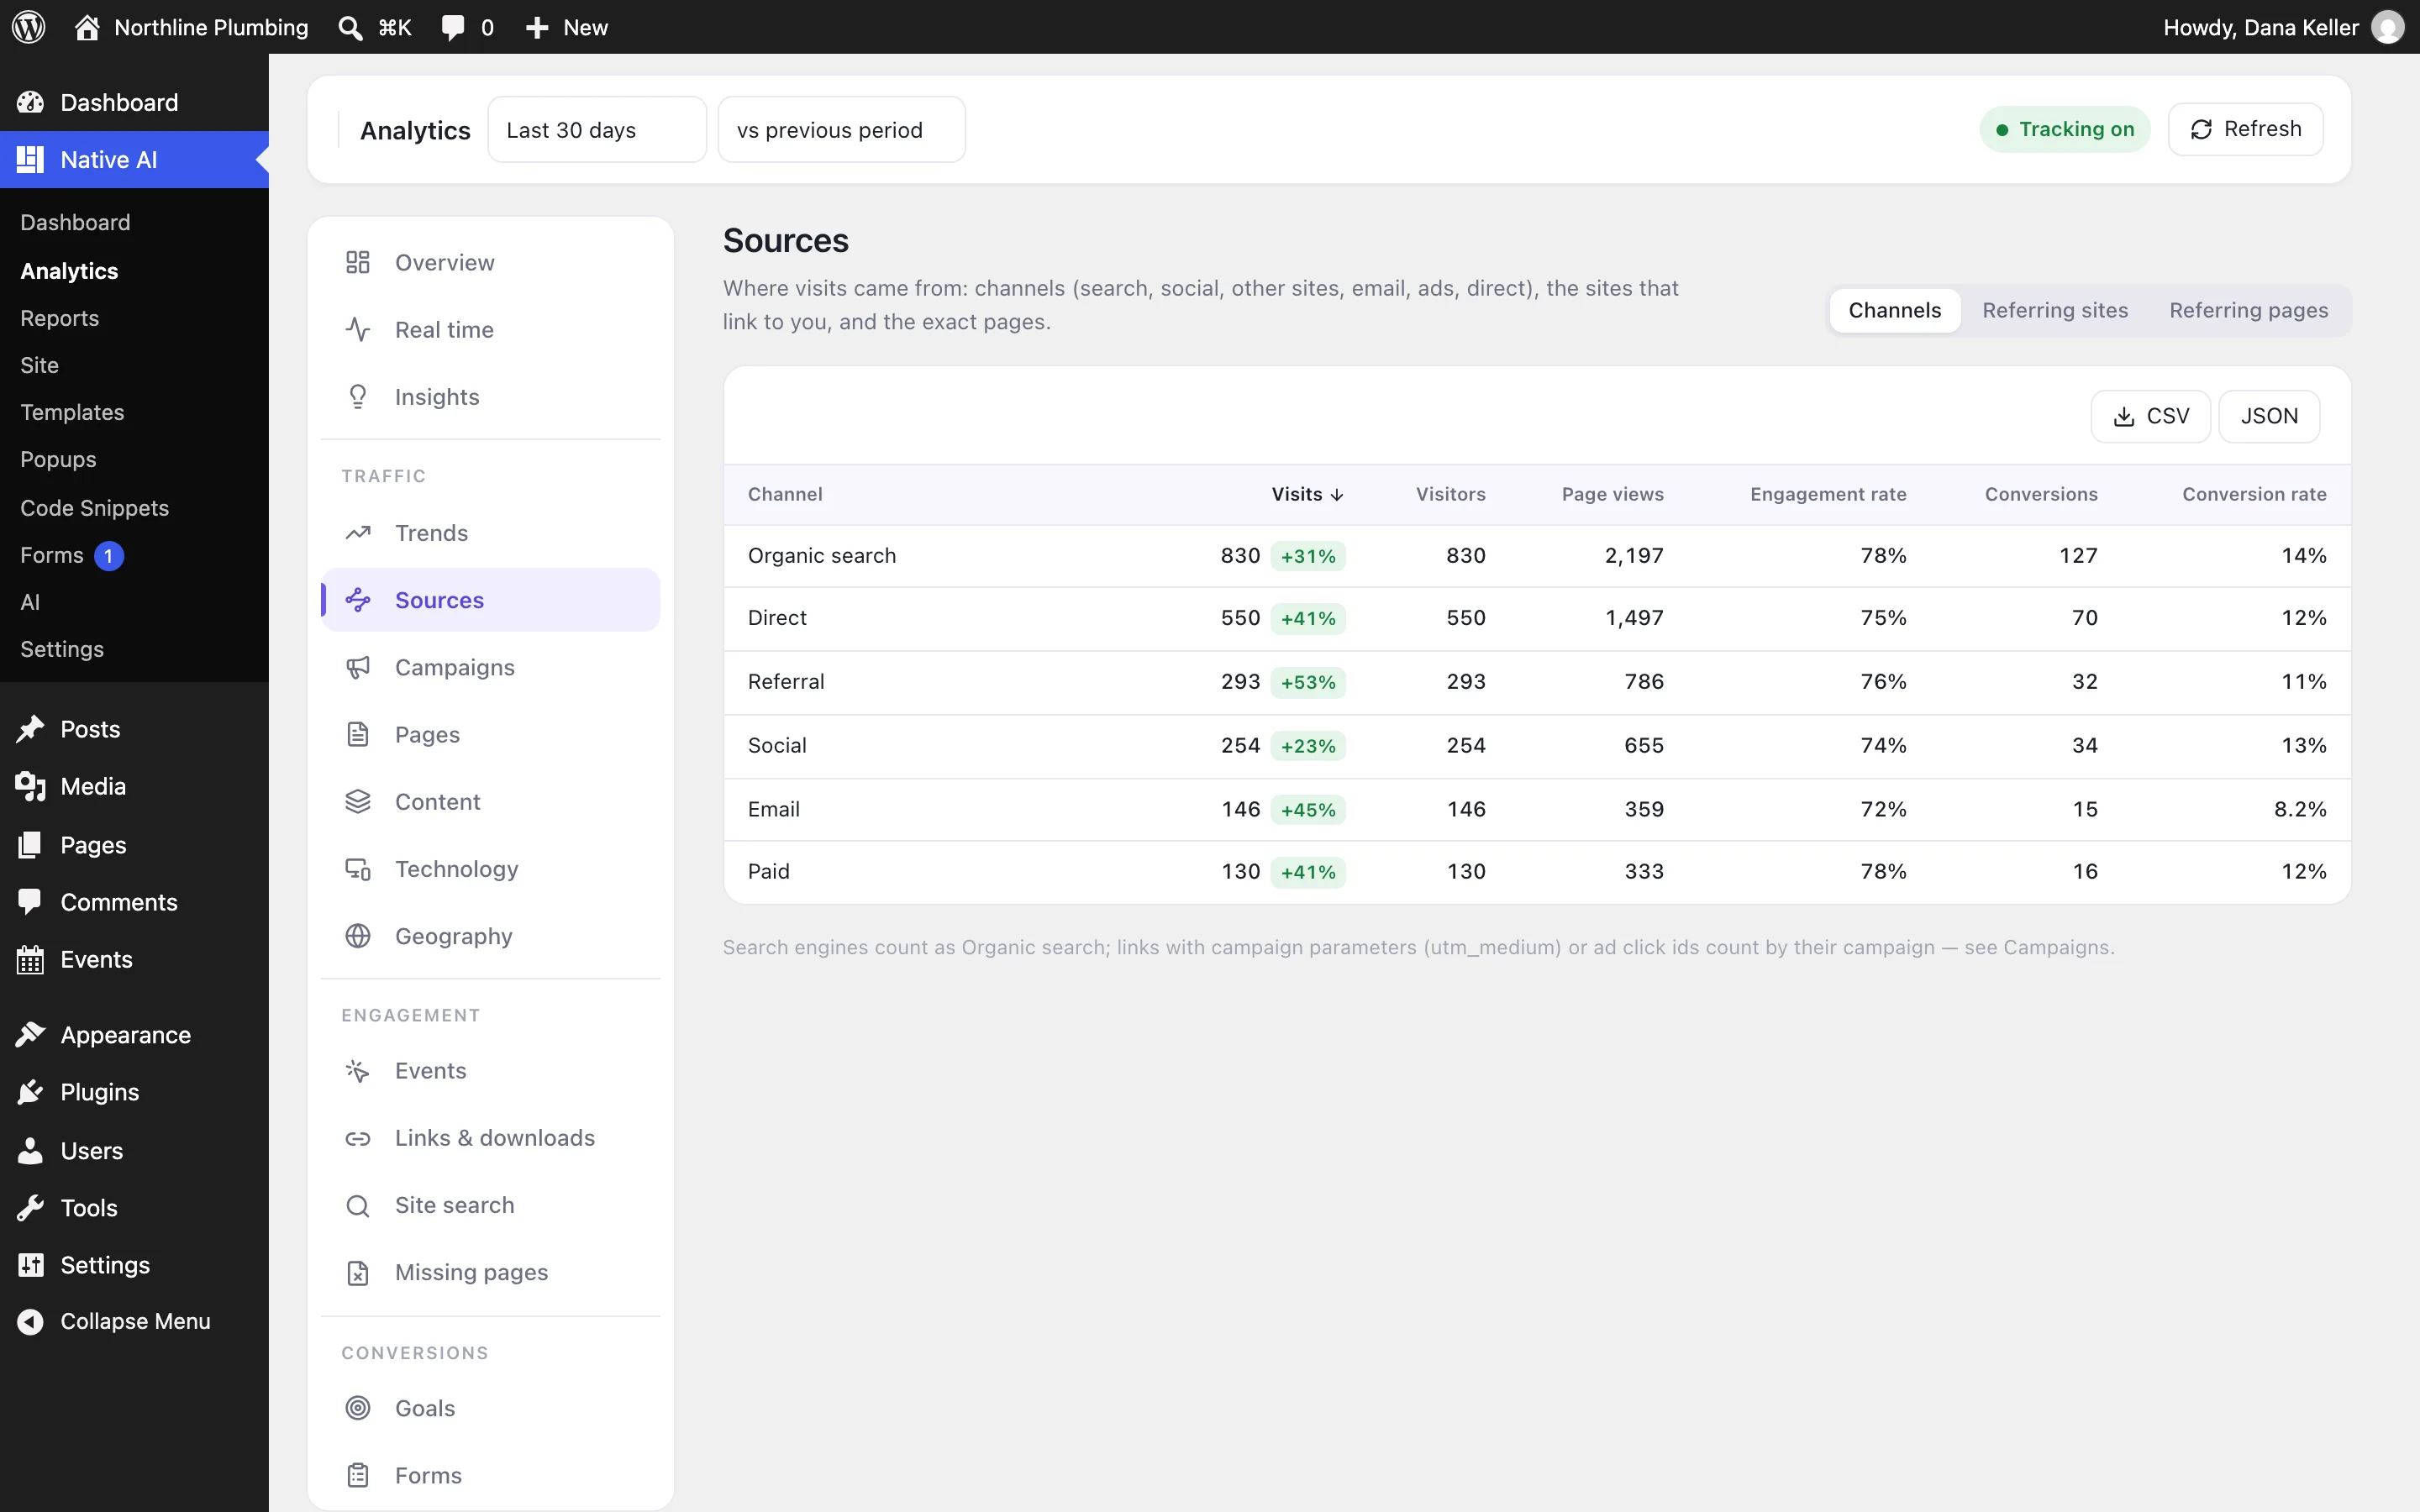
| Sources | Channels — Direct, Organic search, Referral, Social, Email, Paid, Other campaigns — and referring sites and pages. |
| Campaigns | UTM campaigns, sources, mediums, terms and content, with a link builder. |
| Pages | Views, visitors, entrances, exit rate, time on page, scroll depth, conversions — with landing-page and exit-page views. |
| Content | By post type, by Native AI template, and by the terms of any taxonomy (categories, tags…). |
| Technology | Devices (by your breakpoints), browsers and systems. |
| Geography | Countries. |
| Events | Every event, with drill-down. |
| Links & downloads | Outbound links and file downloads, and the pages they were clicked on. |
| Site search | Search terms, searches with no results, and clicks on results. |
| Missing pages | 404 addresses, how often they were requested, where from, and when last seen. |
| Goals, Forms, Popups | Conversions, form funnels and popup performance. See Goals, events and campaigns. |
From numbers to changes#
On the Pages report, each page links to View, Edit with Native AI and Improve with AI. Improve with AI opens the builder with a request already written in the assistant, based on the page’s numbers — you review it before sending. You can also ask the assistant questions like “How did the website perform this week?” or “Which pages get traffic but few conversions?”; it answers with the numbers and the period, and never claims causes it can’t show.
Export#
Every report exports as CSV or JSON for the period (up to 5,000 rows). Exports contain totals only — there are no visitor identifiers to export.
Related articles
On the features pages
Still have a question? Email us at support.